Traceability confirmation across models
Overview
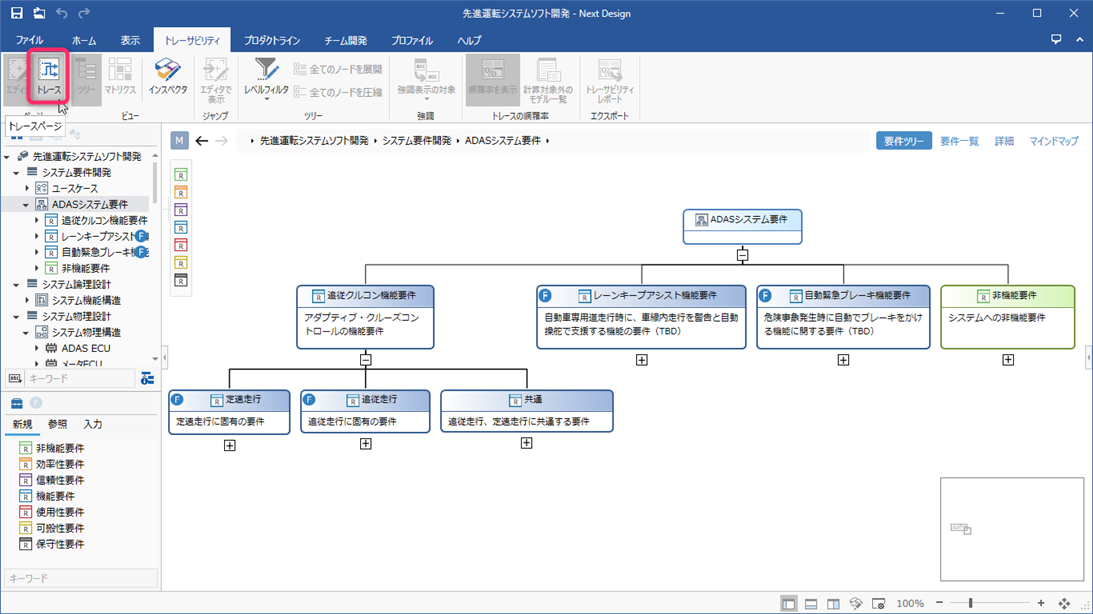
The screen for checking traceability between models is Trace Page. On the tree-style trace page, you can arrange models with a hierarchical structure and check traceability and range of influence across multiple models.
The following describes how to check traceability across models in the following order:
- Switch screens
- Arrange the target models
- Narrow down the traceability confirmation target
- Check traceability across models
- Check the coverage rate of traces for each target model
Switch screens
To display the trace page, do the following:
Operation procedure
Do one of the following from the ribbon:
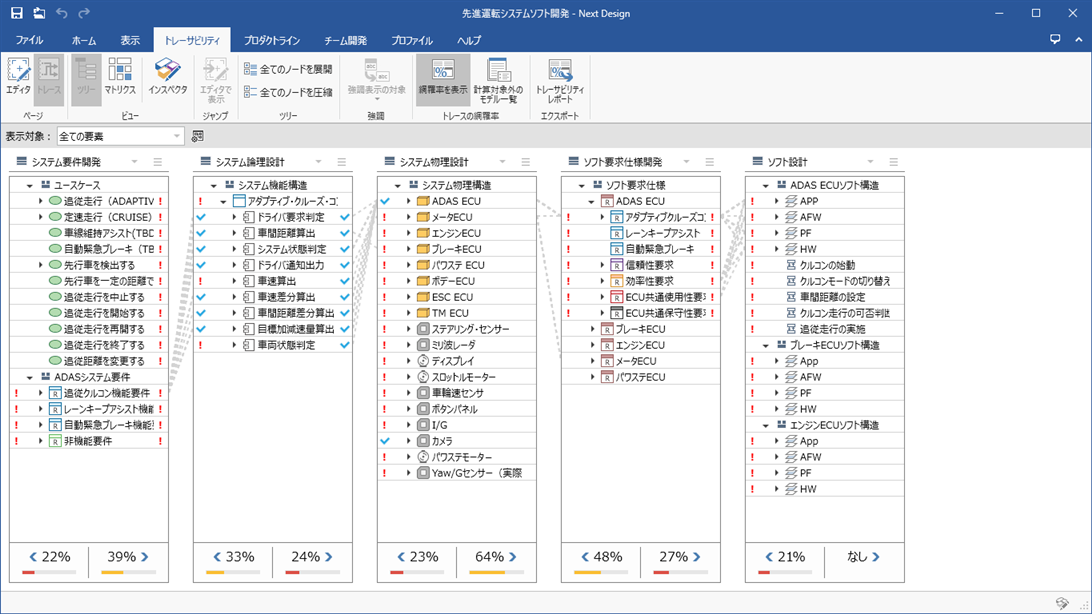
- Click Home> View> Trace on the ribbon.
- Click View> Page> Trace on the ribbon.
- Click Traceability> Page> Trace on the ribbon.
To return to the editor page for editing the model, do one of the following:
- Click Home> View> Editor on the ribbon.
- Click View> Page> Editor on the ribbon.
- Click Traceability> Page> Editor on the ribbon.
Arrange the target models
To add lanes to the trace page and align the target models, follow these steps:
Operation procedure
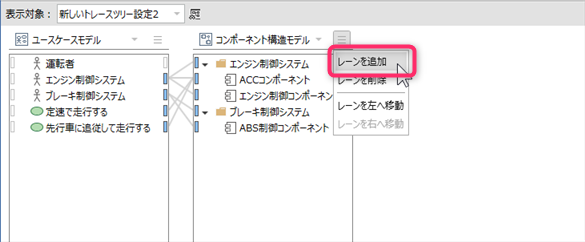
- Run the Add Lane command from the menu button at the top right of each lane to see the model hierarchy in a tree view.
- When you select a model from the tree, a lane will be added on the right to show the selected model.
Attention
- Even if the model has a derivation-related record, the trace line will not be displayed unless the model displayed in the lane to the right is the derivation-related derivation destination.
To change the model displayed in the lane, follow these steps:
Operation procedure
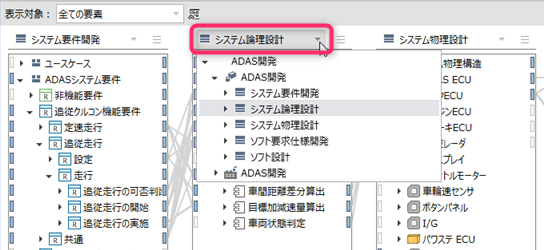
- Change the model from the pull-down list at the top of each lane to switch the model displayed in the lane.
To change the order of the lanes, follow these steps:
Operation procedure
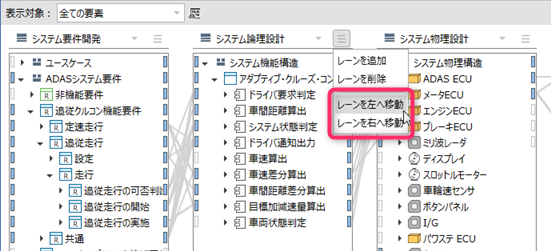
- Execute the [Move Left]/[Move Right] command from the menu button on the upper right of each lane to change the order with the left/right adjacent lane.
Narrow down the traceability confirmation target
To narrow down the elements to be checked for traceability to the metamodel entity and prevent the elements that do not need to be checked from being displayed on the trace page, follow the procedure below.
Operation procedure
- Return to the editor page and select the model you want to hide on the trace page.
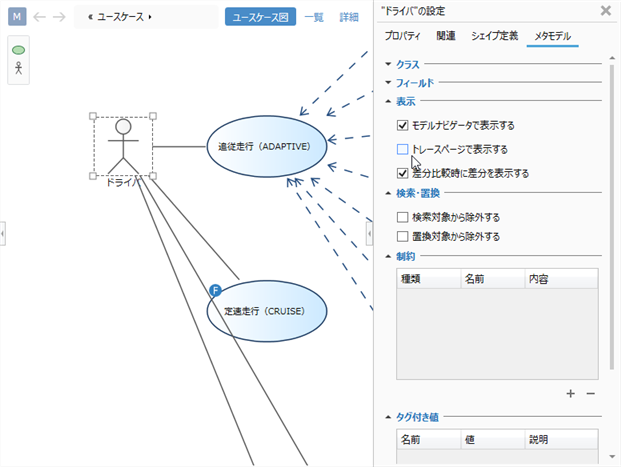
- Click View> Pane> Inspector from the ribbon to display the Inspector.
- Select the Metamodel tab in the tabs at the top of the Inspector.
- Uncheck the Show in Trace Page check box in the View group.
- When you switch to the trace page, the elements corresponding to the same entity disappear from the lane. It is also excluded from the calculation target of coverage rate.
Check traceability across models
To check traceability and range of influence across the target model, starting from any element displayed in the lane, follow these steps:
Operation procedure
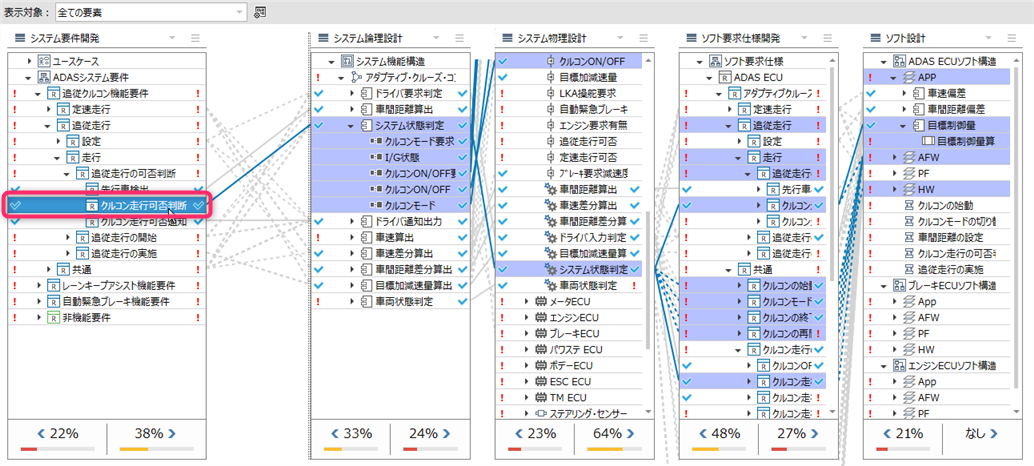
- Click an element of the model displayed on the lane to highlight the relevant element based on the element's derivation relationship and hierarchy.
- Expand the tree for each lane as needed to see the details for each child element.
The meanings of the icons displayed on the lane are as follows.
| Icon position | Meaning |
|---|---|
| Right end | Presence or absence of derivation-related for which the element is the derivation source |
| Left end | Presence/absence of derivation-related for which the element is the derivation destination |
| Icon type | Meaning |
|---|---|
 | One or more derived related |
 | No derivation related |
 | Excluded from calculation of trace coverage |
| No icon | The element itself does not have a derivation association, but the parent element owns a descendant that can have a derivation association |
If there is a derivation association between elements on adjacent lanes, trace lines are displayed between the lanes. The types of trace lines displayed are as follows.
| Line type | Meaning |
|---|---|
| Solid | Tracing lines between elements for which a direct association is defined between the metamodels of the elements to which the tracing lines connect (e.g. Tracing lines between elements that are both displayed in tree-expanded form in adjacent lanes) |
| Dash Line | Tracing lines between elements for which relationships are defined indirectly between the metamodels of the elements to which the tracing lines are connected (e.g. Trace lines between elements where the tree is collapsed and hidden in one of the adjacent lanes) |
note
- To display only the trace lines between the elements represented by the solid line without displaying the trace lines between the child elements represented by the dotted line, select [Traceability]> [Traceability]> [Show Trace]> from the ribbon. Select Show direct traces only.
- To show both the dotted and solid lines, select Traceability> Traceability> Show Traces> Show Direct and Indirect Traces from the ribbon.
Check the coverage rate of traces for each target model
Check the coverage rate of the trace information with the derivation source (left)/derivation destination (right) with the percentage displayed at the bottom of each lane.
How to calculate the trace coverage rate
The coverage rate is calculated by the following formula for each trace direction (derivation source/derivation destination) in each lane.
Coverage rate = number of elements with one or more derivation associations/number of elements with derivation associations
If the element itself does not have a derivation association but its descendants have a derivation association, it will appear as a parent element in the lane tree, but will not be included in the denominator of the formula.
Percentages after the decimal point are rounded up. However, if it is 99% or more and less than 100%, it will be devaluated to 99%.
Always calculated based on the 150% model, regardless of the state of product application.
tip
- To check the trace coverage rate when the product is applied, you can check it by exporting the project after applying the product and displaying the trace page. For information on how to export, see Modeling Guide> Product Line Development> Exporting Design Models for Product Applications. give me.
Restrictions
- If an element can have multiple types of derivation associations in the same trace direction, and if there is one or more derivation associations of any one type, that element is calculated as having derivation associations.
- For example, if an element of a requirement model can have two types, a derivation relationship with an element of a logical design model and a derivation relationship with an element of a physical configuration model, if there is one or more derivation relations of the former, the latter derivation Even if it is not related, it is calculated as derived related.
To specify a specific element outside the scope of trace coverage calculation, follow these steps:
Operation procedure
- Right-click on the lane the element you want to exclude from the trace coverage calculation to open the context menu.
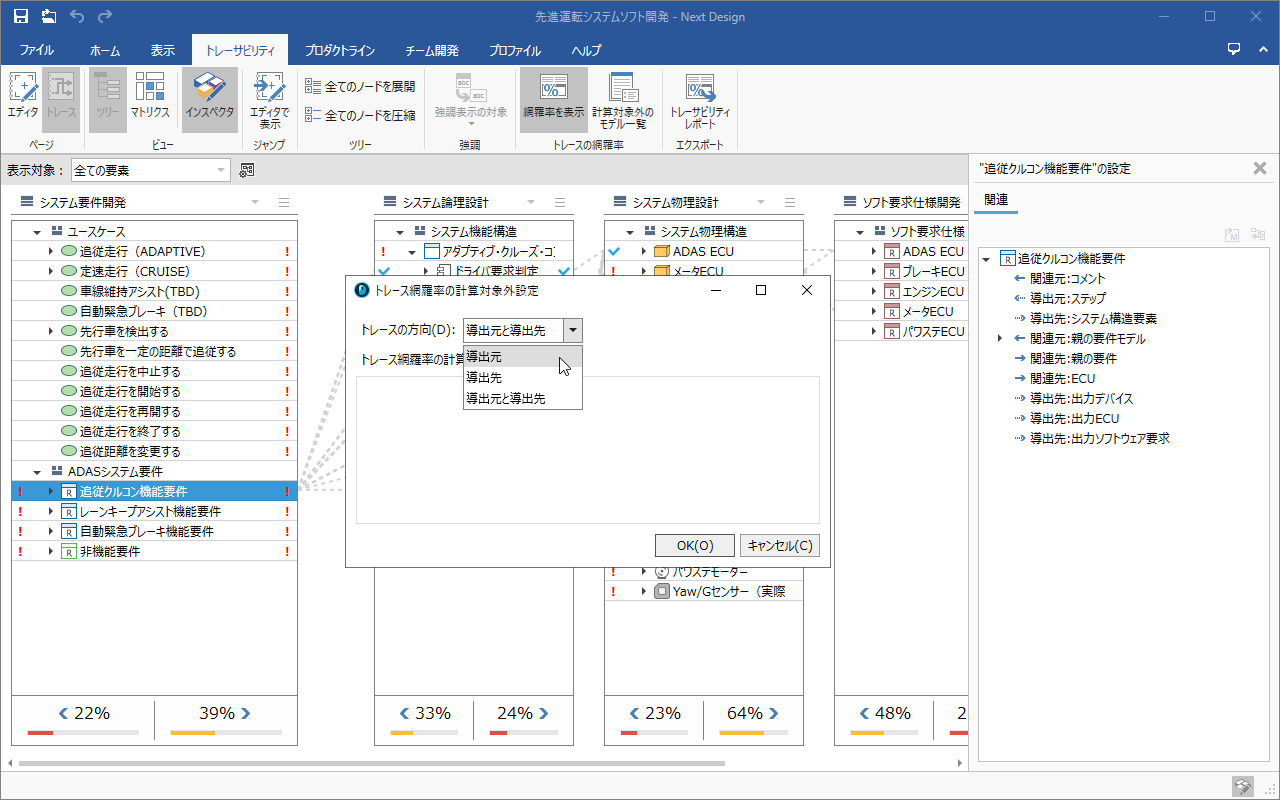
- Run Exclude traceability coverage from calculation from the context menu to open the Exclusion setting of Traceability Coverage dialog.
- From the Trace Direction choices, select the direction you want to exclude from the calculation.
- Enter the reason in the Reasons for excluding the calculation of trace coverage text box and click the [OK] button.
- The icon on the side selected in [Trace Direction] changes to an icon indicating that the trace coverage rate is not calculated.
- Click Traceability> Traceability Coverage> Show Models Excluded from Calculation from the ribbon to list the elements that are not included in the calculation and why.
note
- To specify the metamodel entity and exclude the relevant elements from the calculation target of the trace coverage rate at once, refer to "Restricting the target of traceability check" above.